As fall gives way to winter, we're all left clinging to the best vestiges of the passing season: the changing leaves, college football, temperatures above freezing and, for many of the most
basic amongst us, the pumpkin spice latte. Debuted by Starbucks in 2004, and featuring no actual pumpkin content, the pumpkin spice latte has become a staple of fall, with Ugg boots and yoga pants-wearing women practically crawling out of the woodwork to get their hands on the thing. And while
Starbucks touts that over 29,000 tweets have mentioned #pumpkinspice since 2012, we suspected there was much more to the story of the pumpkin spice latte [1]. Despite the fervor, we noticed that there's been no definitive tracking of the geographical expansion of the pumpkin spice latte as it seeks to colonize the world of regular, everyday people drinking plain ol' coffee.
Searching only for the latest manifestation of the pumpkin spice phenomena, we collected all geotagged tweets in the continental United States for September and October 2014 with references to either "pumpkin spice" or "#psl", yielding a total of 19,537 tweets. But rather than simply mapping the basic distribution of these tweets, we've instead normalized this data by tweets referencing "coffee" during the same period. Using a 25% sample of all of these coffee-related tweets -- totaling 42,696 tweets -- aggregated to hexagonal cells, we calculated the odds ratio at the lower bound of the 95% confidence interval in order to provide a bit more context and account for any number of biases within the data. Using this measure, we've identified those places with greater-than-usual numbers of pumpkin spice latte tweets relative to those tweets referencing coffee (orange), and vice versa (purple), as seen in the map below.
References to Pumpkin Spice Lattes relative to References to Coffee [2]
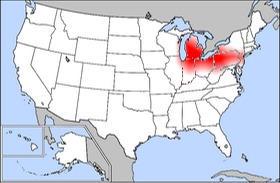
Based on our binary classification, it's evident that the vast majority of the country has stuck with their preference for coffee, even during the PSL's peak season. But given that our interest is in mapping the prevalence of the PSL in particular, we want to pay closer attention to the smattering of orange hexagons in the map. While there are no definitive clusters of PSL-related tweeting, if you squint your eyes you can just barely visualize a belt of pro-PSL places stretching from St. Louis up to Chicago, and from Cincinnati up to Toledo and Detroit, and from Cleveland to Pittsburgh, what we've termed
"the basic belt". While this belt roughly corresponds to the vernacular region of the Rust Belt, Ohio in particular sits at the center of this pumpkin spice-loving portion of the country, representing the buckle on our belt [3]. Given this clustering of PSLs, we suspect that the Buckeye State might well be on its way to becoming the Pumpkin Spice State.
----
[1] Well, actually, Renee Kaufmann had this hunch. All credit for the idea behind this post goes to her.
[2] Sorry about the Web Mercator projection,
y'all.
[3] Can one still wear a belt with yoga pants?


 Posts
Posts